
System Dashboard
Summary of all data services, components, and component states within the Ascend environment.
The Ascend Dashboard is the first view you see when logging into Ascend. You can access the Dashboard from any page of the platform by clicking on the Ascend logo in the top left corner.
Using the Ascend Dashboard, users can easily view a summary of all the Data Services they have access to. The summary includes the number of Read Connectors, Transforms, Write Connectors, and Data Share Connectors.
InformationEach user will only see the Data Services they currently have access to. Data Services the user does not have access to will not appear on their view of the Dashboard.
Show Components by State
To see a chart of all components and their current states across all viewable Data Services click on the BY STATE filter on the left side of the Overview panel. For example; this can help show a list of all components that are in one of the following states: UP TO DATE, RUNNING, OUT OF DATE, ERROR, or NOT AVAILABLE.

By getting a list of Running components in the system, users can see which component system resources are being allocated to at the moment. Users can also get a list of Pending components in the system. These are components that cannot be processed yet either because their upstream dependencies aren't ready, or the system doesn't have sufficient resources.
TipClicking on any particular bar in the graph will bring up a drop-down list (on right-side) of all components of that type. Clicking on any component in that drop-down list will redirected you to that component!
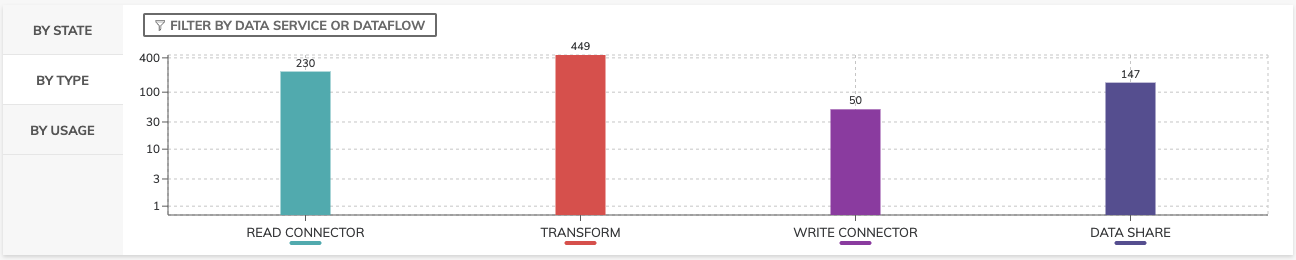
Show Components by Type
To see a graphic distribution of all component types across all viewable Data Services click on the BY TYPE filter on the Overview panel on the left. Use the Filter by Data Service or Dataflow to refine your view.
Show Components by Usage
To see a chart of usage metrics, select BY USAGE. The Billing Metric selections include Ascend Credits, Snowflake Credits, Databricks DBUs, and vCPU-hours. You can filter the results using the date range and group usage by all, name, or data plane type type. For example, the below chart shows Ascend Credits by Data Plane type over a seven day period.
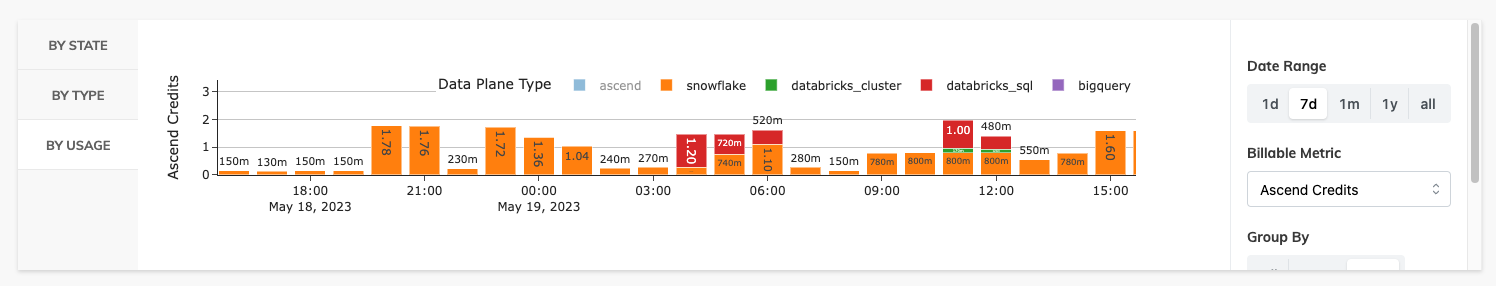
TipYou can select and deselect items within the legend above the graph to isolate usage information for either Data Plane Name or Data Plane Type by clicking on the name or type.
Also, you can hover over a bar within the chart view more details about the usage metric at a particular time interval.
Updated 11 months ago