
Tutorial - Building an Advanced Dataflow

Introduction
In this tutorial we're introducing the Ascend platform with a high-level overview of the environment including the system dashboard and more importantly how to build your first Dataflow using Read Connectors, Transforms, Write Connectors and data feeds. We'll be using publicly available NYC weather and taxi cab data to do some useful analysis and explore a few insights using SQL and PySpark transforms. Let’s get started…
Important!In order to follow along with this tutorial, you should either have your own Ascend environment (paid account) or a free trial version. Go here to request a trial of the Ascend platform.
The Datasets
Weather data in New York City - 2012 - 2017
Weather data collected from the National Weather Service. It contains monthly data from 2012 to 2017, for a weather station in central park. It contains for each day the weather (e.g. cloudy, rainy, sunny, pouring) and the level of precipitation.
Yellow Cab Taxi Data - 2016
This dataset is based on the 2015 NYC Yellow Cab trip record data published by the NYC Taxi and Limousine Commission (TLC). It contains the following data columns: Vendor_id, pickup_datetime, dropoff_datetime, passenger_count, trip_distance, pickup_longitude, pickup_latitude, store_and_fwd_flag, dropoff_longitude, dropoff_latitude, payment_type, fare_amount, mta_tax, tip_amount, tolls_amount total_amount, imp_surcharge, extra rate_code.
Green Cab Taxi Data - 2016
This dataset is based on the 2015 NYC Green Cab trip record data published by the NYC Taxi and Limousine Commission (TLC). It contains the following data columns: Vendor_id, pickup_datetime, dropoff_datetime, passenger_count, trip_distance, pickup_longitude, pickup_latitude, store_and_fwd_flag, dropoff_longitude, dropoff_latitude, payment_type, fare_amount, mta_tax, tip_amount, tolls_amount total_amount, imp_surcharge, extra rate_code.
System Dashboard
When you log in, you see the main Ascend System Dashboard. This is a high-level view of your entire Ascend environment. You can see all the data services, their respective data flows, and user and team members in one place.
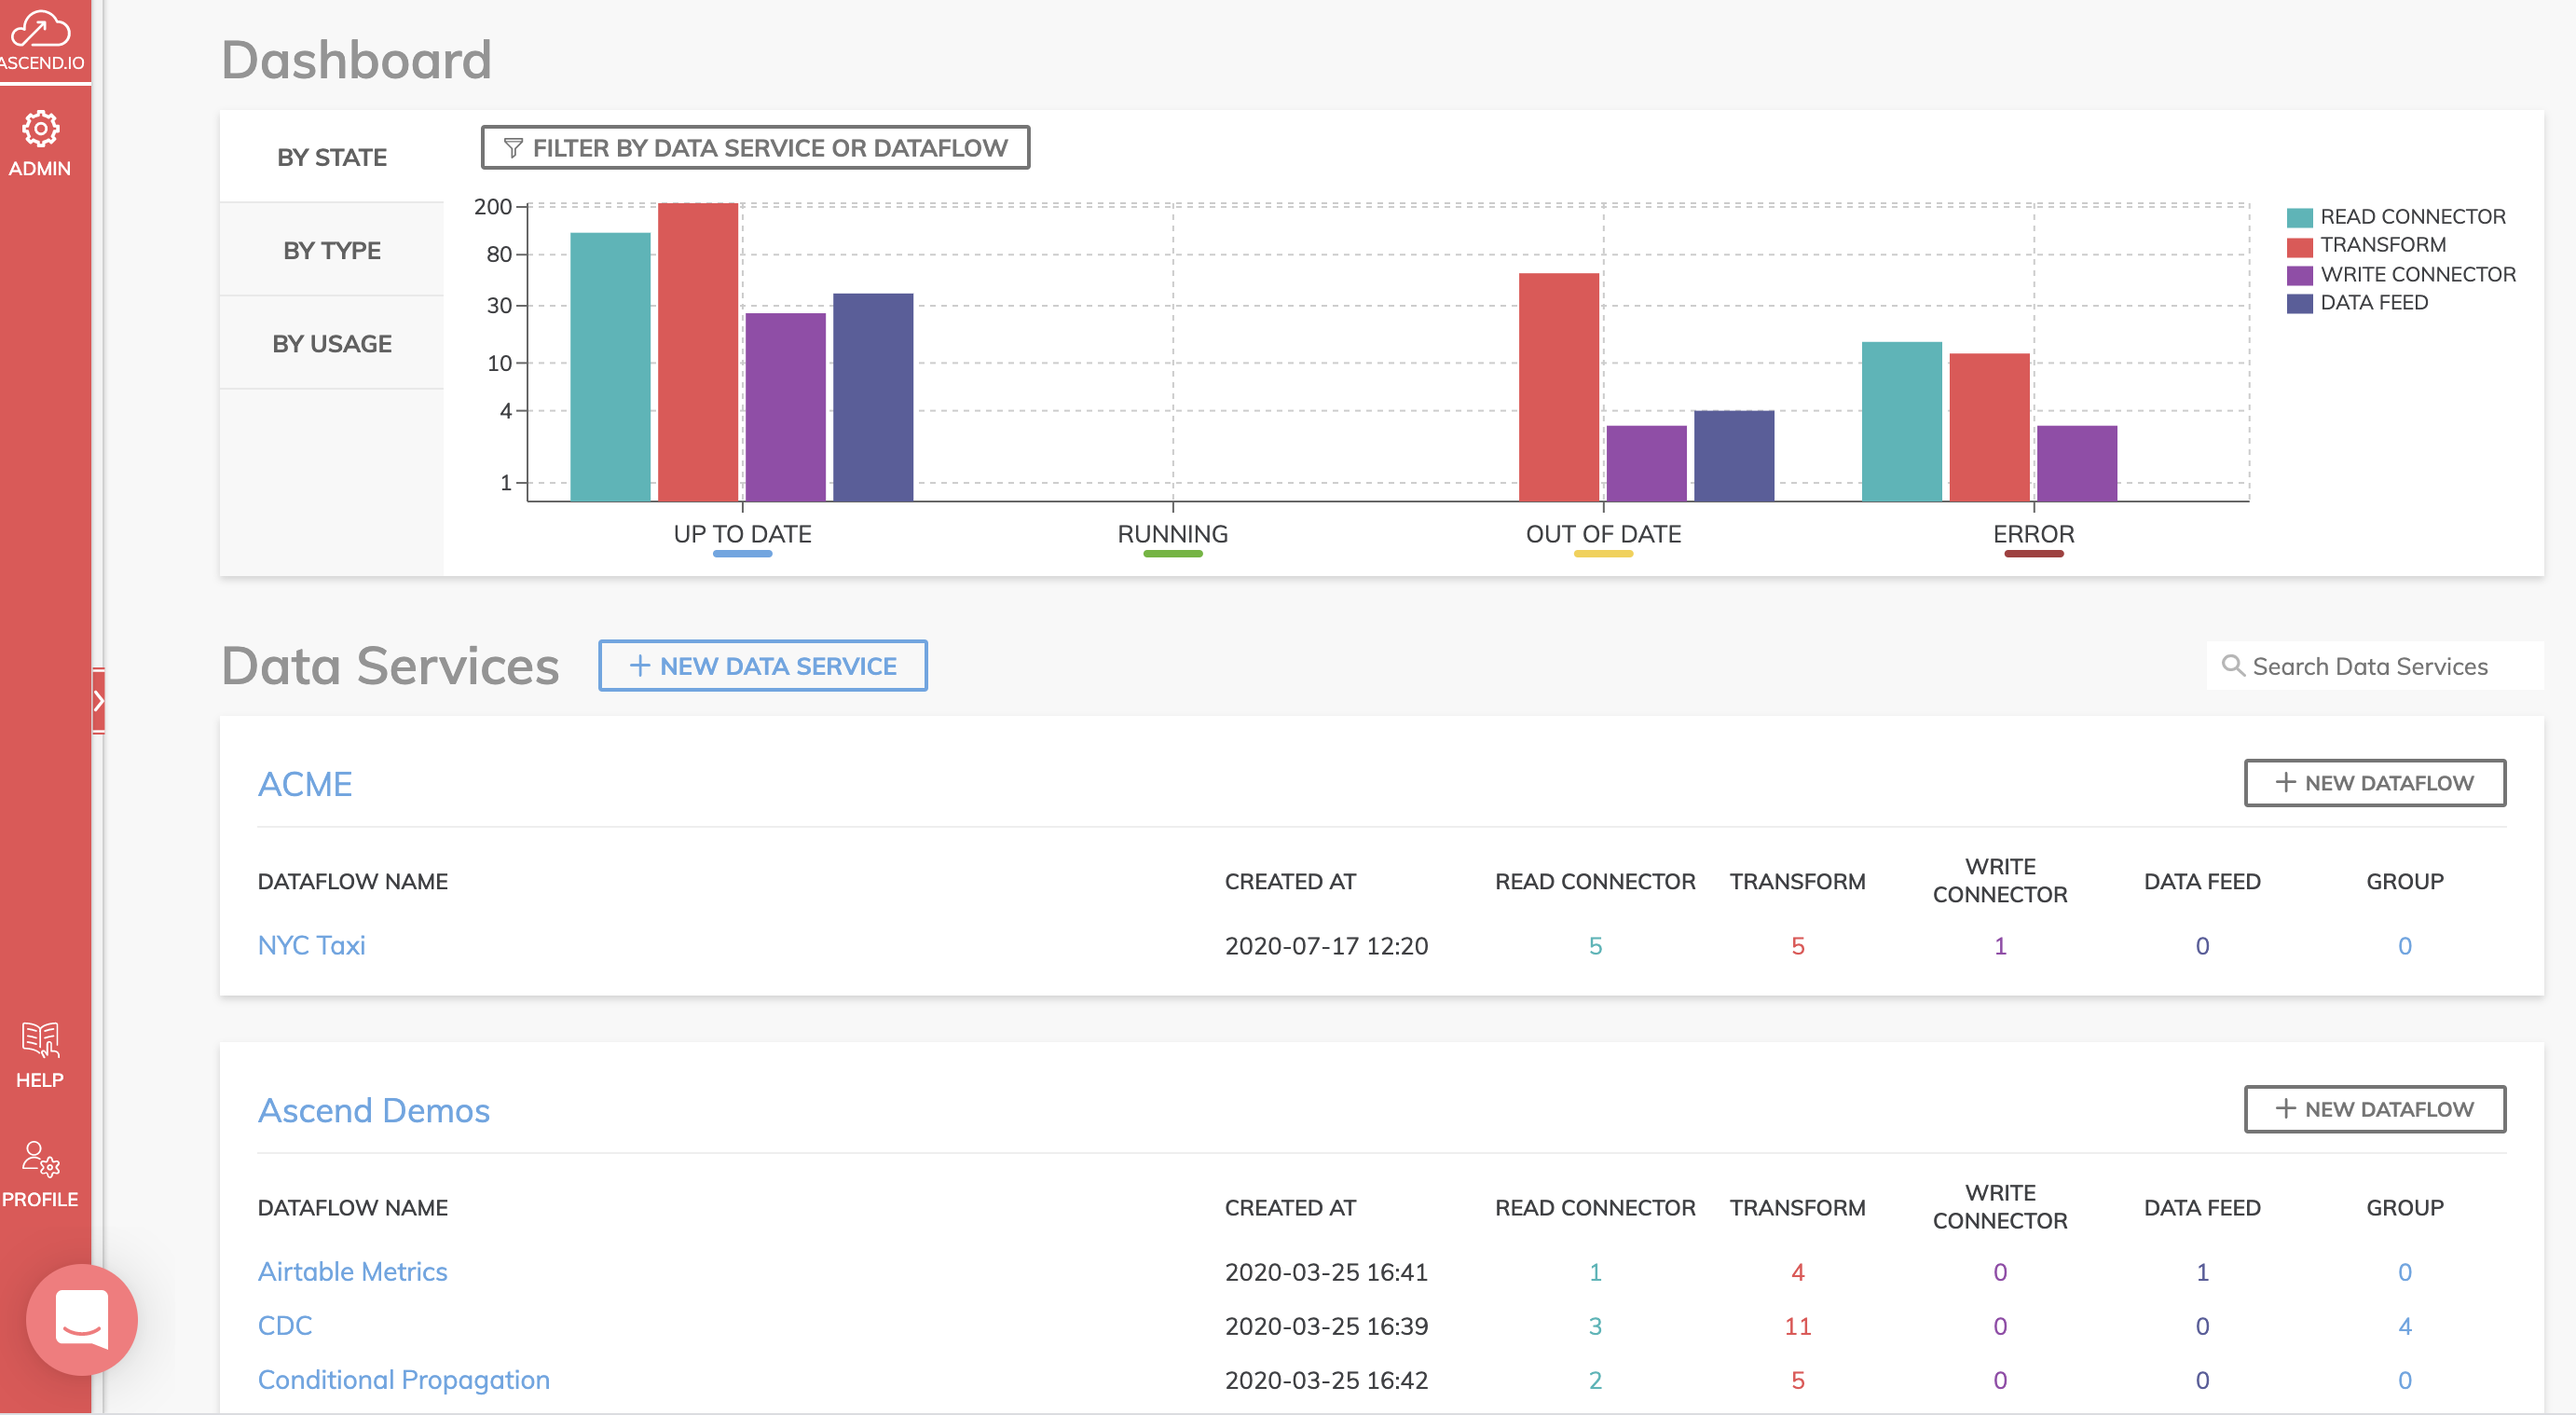
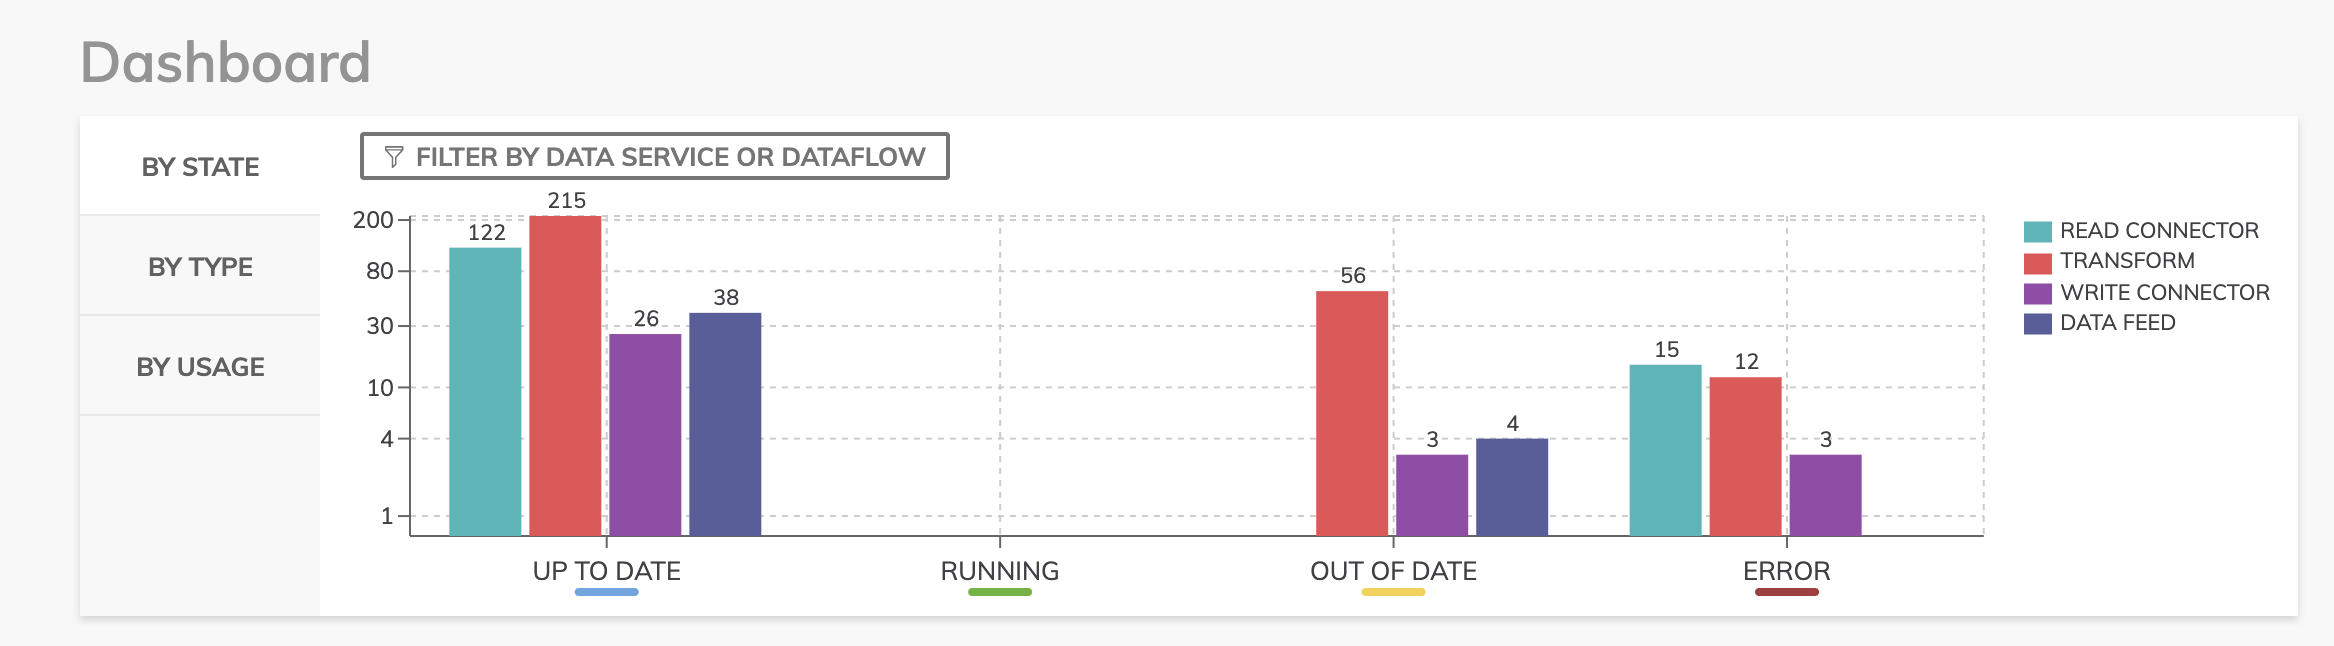
At the top of the dashboard, you’ll see a graph showing the current state of all components across all Dataflows and the data services they reside in. There are four main components in a Dataflow and here you can see the current state of our read connectors, transforms, write connectors and data feeds. We’ll go into more detail on these later.
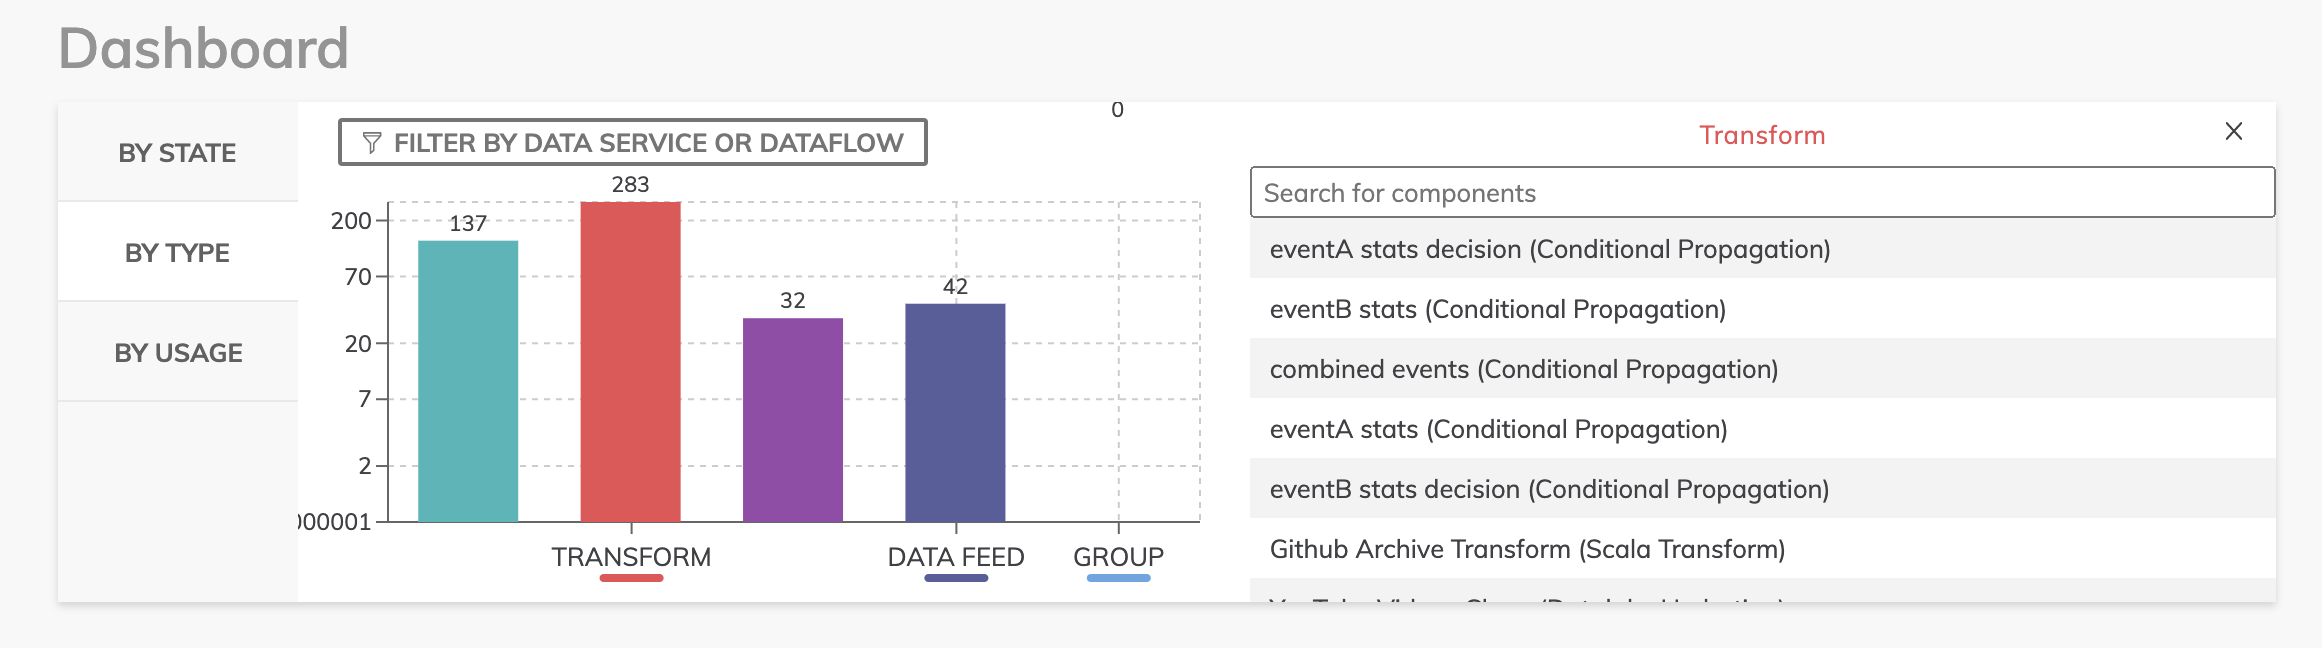
In addition, I can filter by component type to get a view of how many of each component exists within my Ascend environment.
Create a Dataflow
Dataflows are continuously running data pipelines. You design a Dataflow with a combination of declarative configurations, SQL, and Python. As you design Dataflows, you are creating a blueprint that is sent to the Ascend Dataflow Control Plane to be automated. For this tutorial, you will create a new Dataflow within your Data Service.
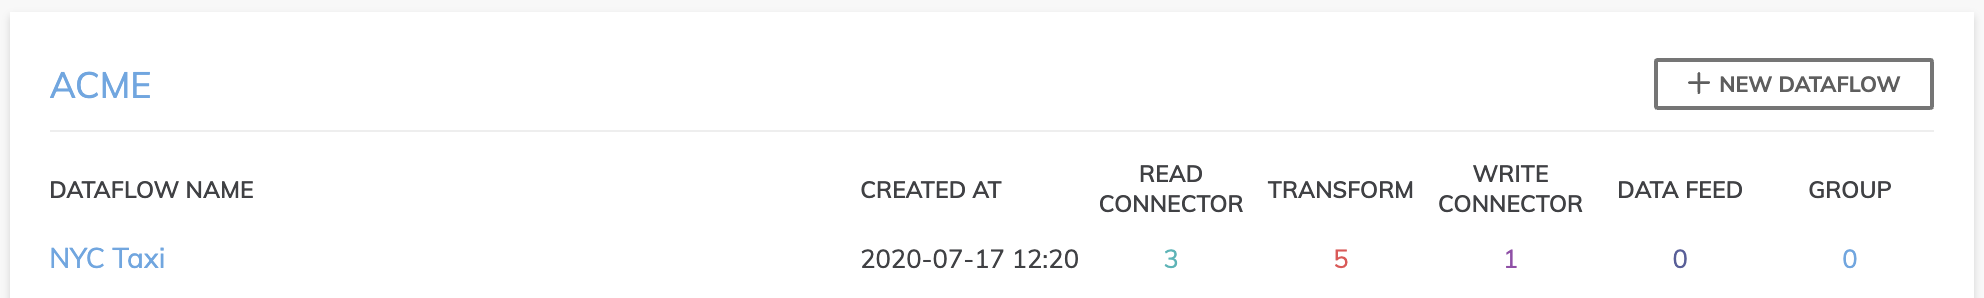
- Create a new Dataflow called NYC Taxi by clicking the + NEW DATAFLOW button next to your Data service.
- Optionally provide a brief description and click CREATE and you've instantly created your Dataflow.
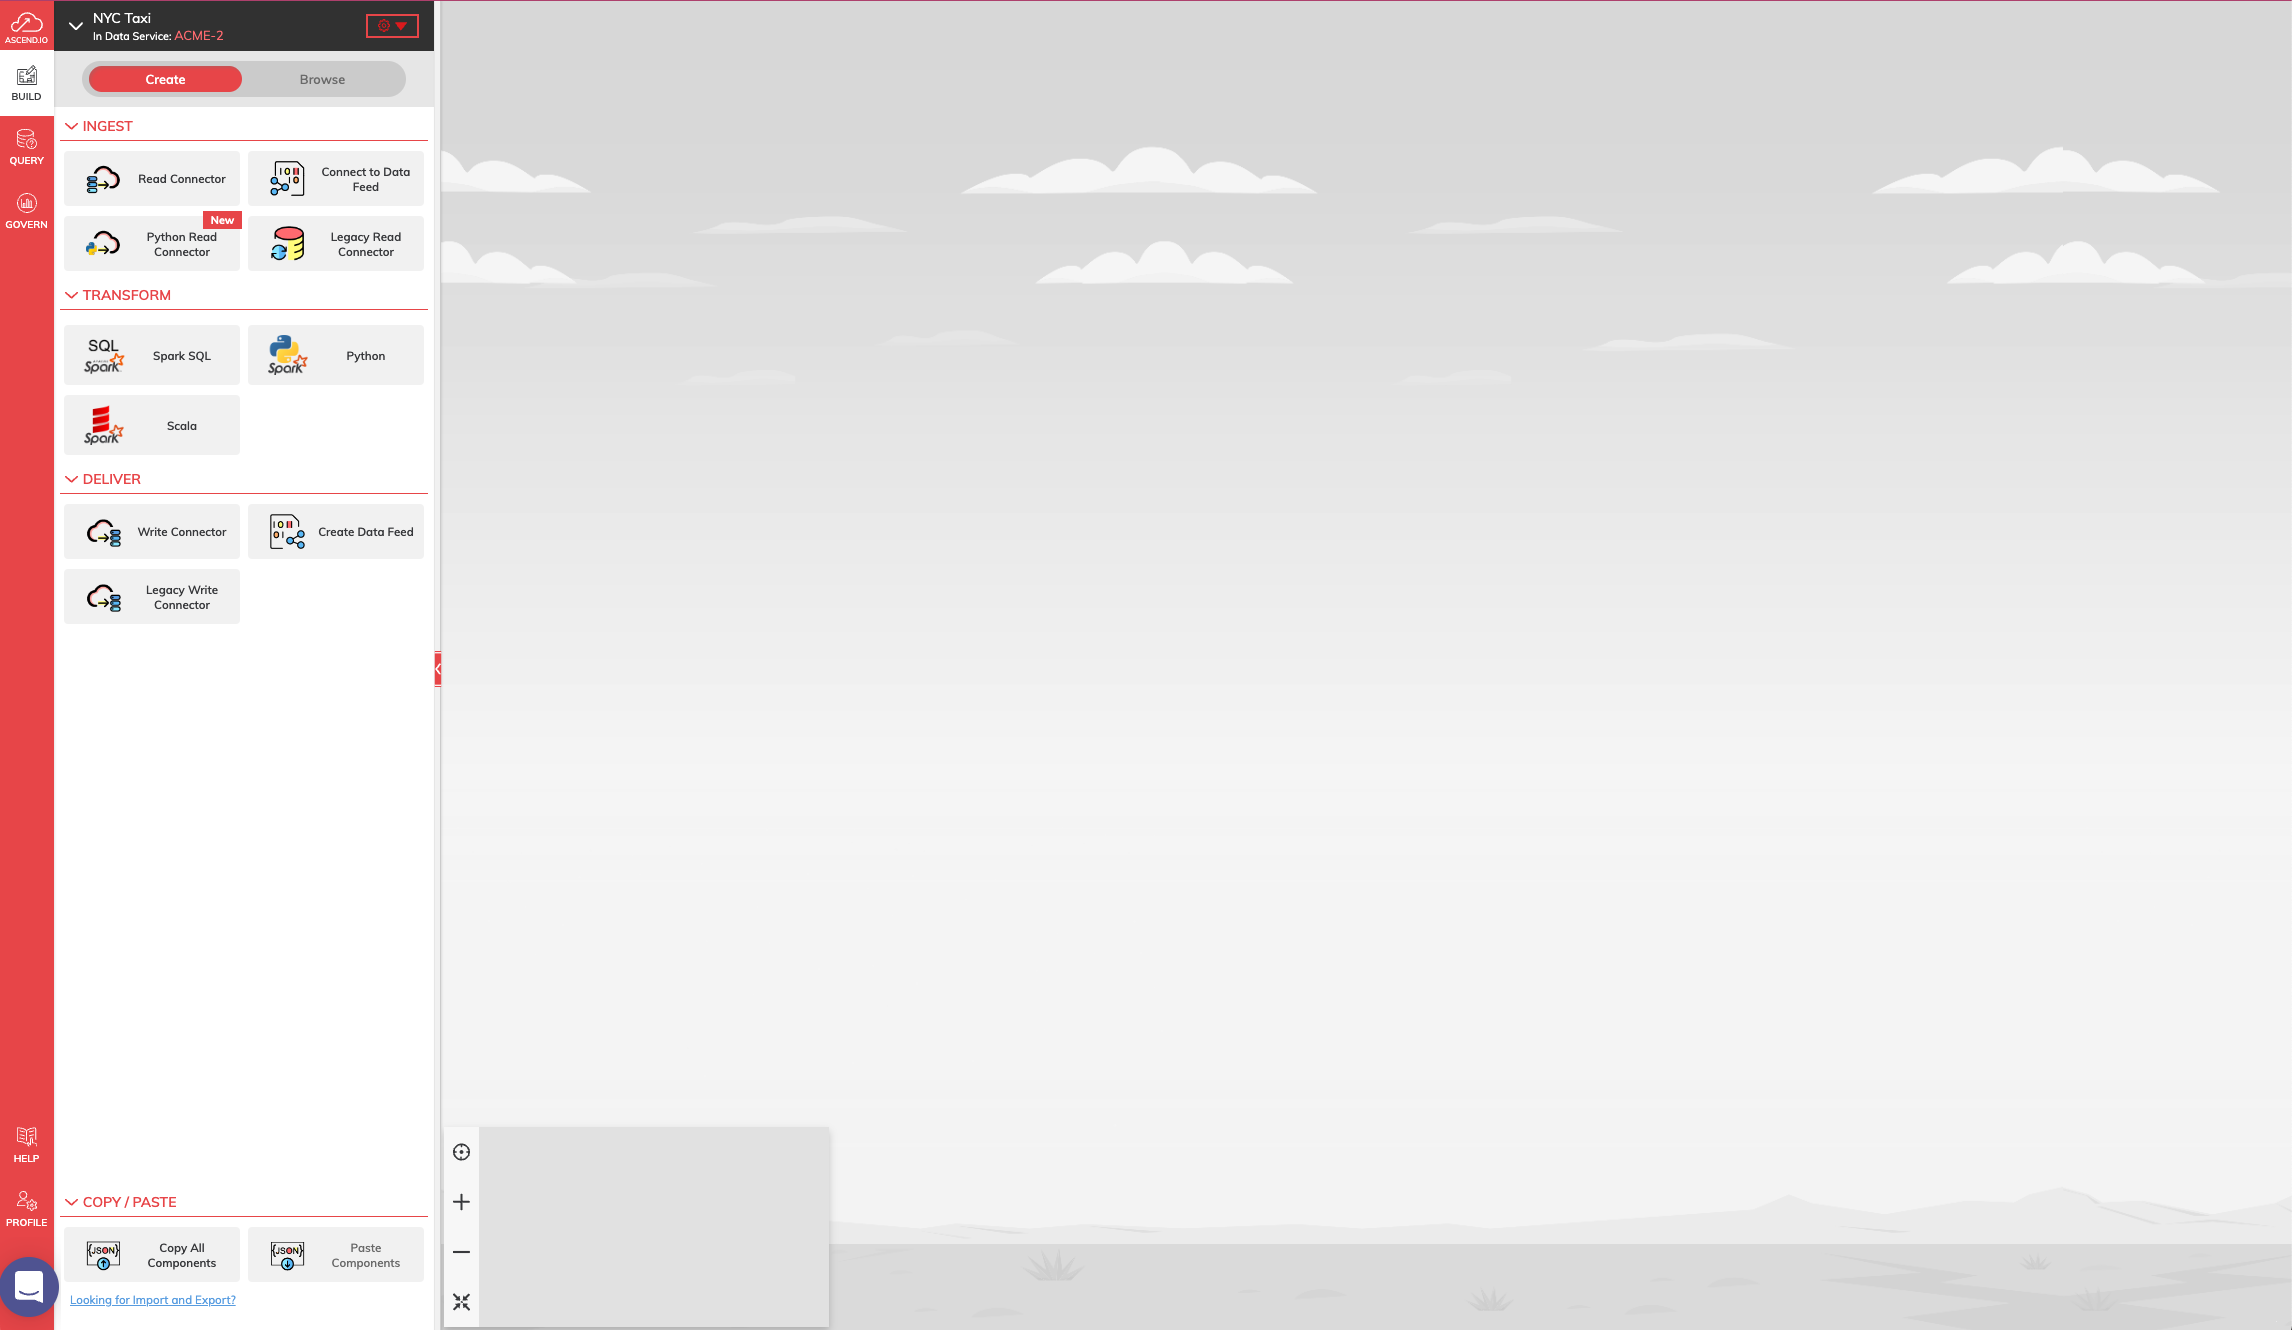
- What you see here is what we refer to as the canvas and it’s in this screen that you’ll be constructing your Dataflow. Let’s jump in.
You should have something which looks like this in your dashboard.
Dataflow Overview
Once inside the Dataflow canvas, we can explore some of the essential things (e.g. menus and options) you'll need to be familiar with before we move on.
- The dashboard icon will take you back to the system dashboard.
- The Data Service menu will show you a list of all data services you can quickly jump to along with managing various settings and permissions.
- The Dataflow menu allows settings and permissions configuration for this Dataflow or others within this data service.
- The Create tab is what you’ll be using most of the time and it’s from there where you can create new read & write connectors, transforms, data feeds and the grouping of components for better Dataflow visibility.
- The Browse tab is what you’ll use to select different dataflow components.
- The Query icon gives you the ability to perform a quick on-
demand query, much as you would an ad-hoc query into your data warehouse. - On the bottom left-hand of the screen, you’ll see a Help icon for our online docs and a Profile icon for your login name, access keys and other settings.
Creating Read Connectors
The first step in our Dataflow is to create Read Connectors that access the weather and taxi cab data from S3. Read Connectors allow Ascend to access any data from any source with any format.
Create "Sample Datasets" Read Connector
- On the upper left side of the screen, if it has not been selected, click CREATE and then click Read Connector to bring up the Connectors panel. From the Connectors Panel, click NEW CONNECTION and you'll get a list of all possible pre-built connectors to choose from where you can also quickly build your own custom connector if you desire.
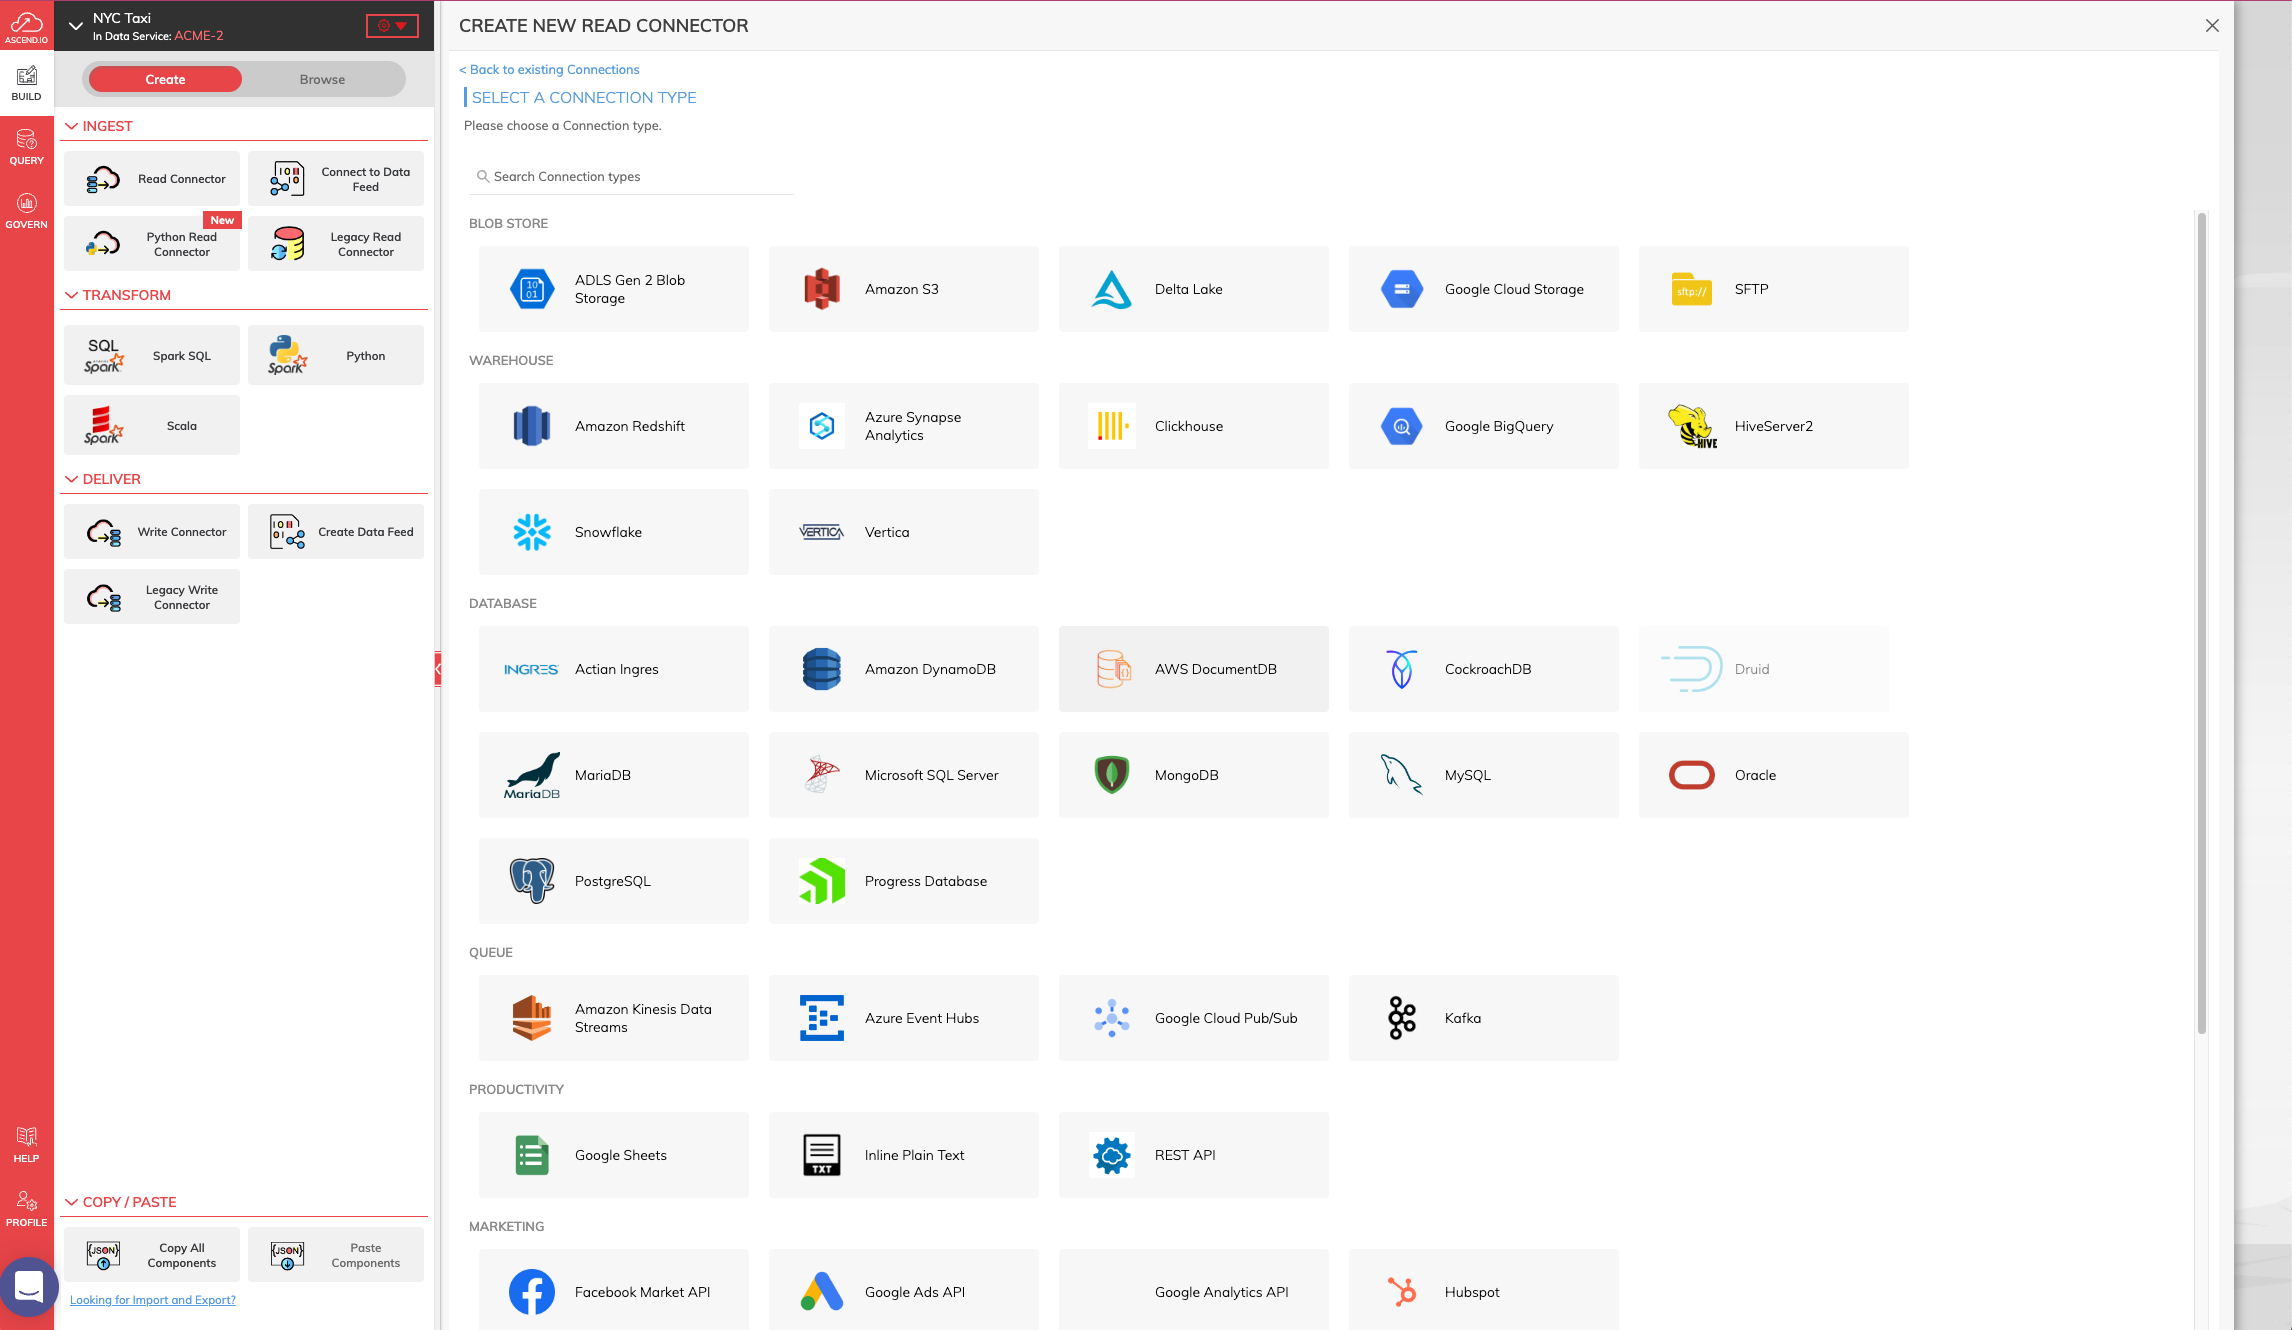
-
For this tutorial, we will be connecting to an AWS S3 source so select the Amazon S3 connector from the Connectors Panel.
-
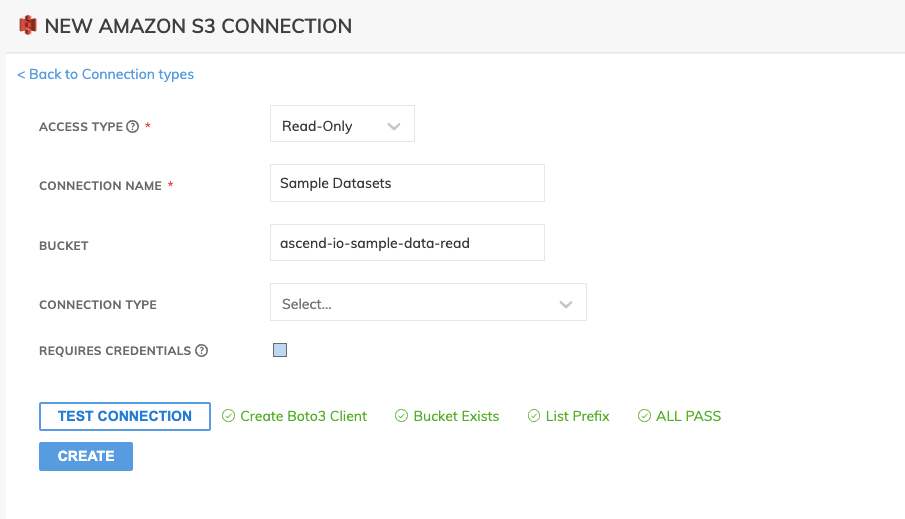
As we only are reading from this connector, let's leave it as Read-Only.
-
Create the name of the connector as Sample Datasets and optionally provide a description.
-
Enter ascend-io-sample-data-read as the bucket name.
-
Uncheck the Requires Credentials checkbox.
-
Use TEST CONNECTION to check whether all S3 bucket settings and permissions are properly and correctly configured
-
Click CREATE to save this connection for future use.
- Once your connection is saved, you will see the S3 connection listed below when you choose Read Connector on the left panel.

-
Let's click on USE on the Sample Datasets S3 read connector and select skip and configure manually. Enter Weather as the NAME and you can leave BUCKET empty as you have already specified the bucket to use.
-
Select Match as OBJECT PATTERN MATCHING and enter NYC-TAXI/weather/weather.csv as the OBJECT PATTERN.
S3 Pattern Specifications
-
Select CSV as PARSER.
-
For HEADER ROW, check the Files have a header row checkbox.

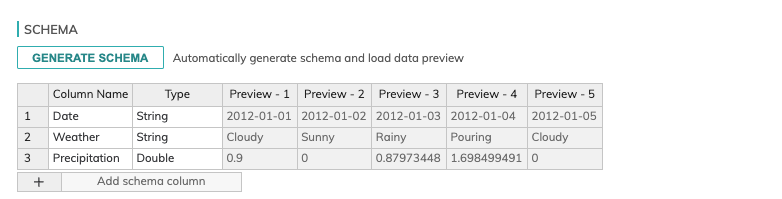
- Schema Settings
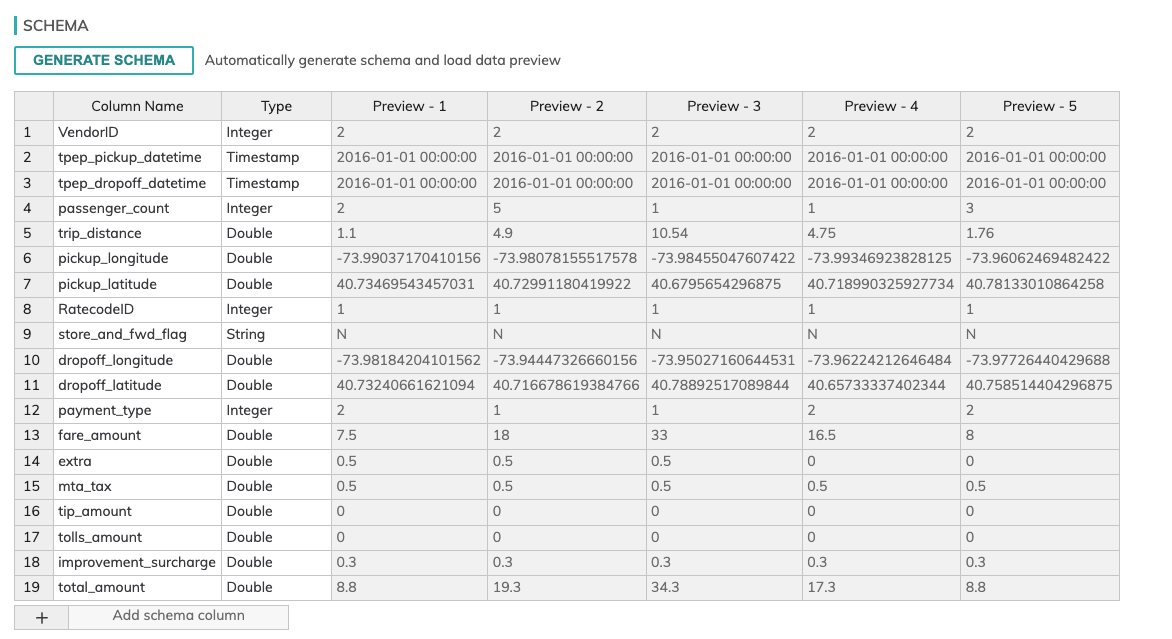
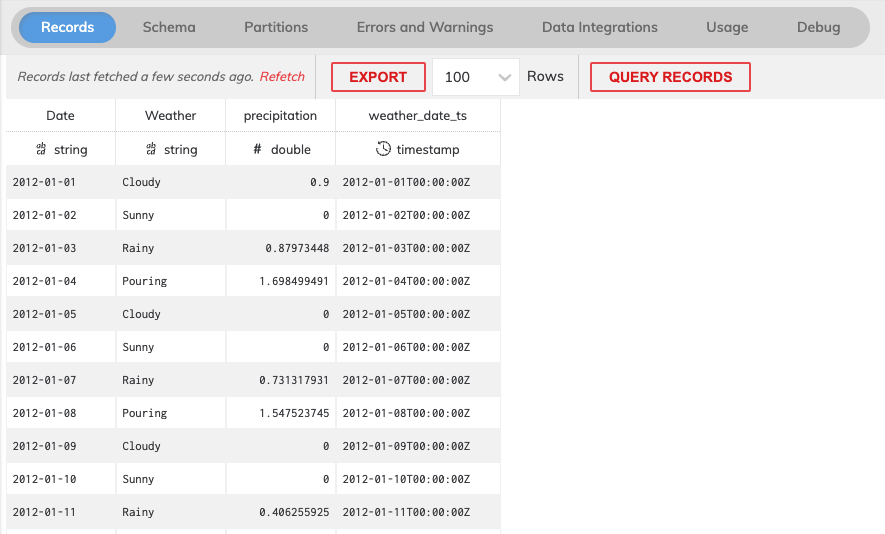
Click on GENERATE SCHEMA to see a preview of the CSV to confirm everything looks accurate (as shown below). Ascend will automatically parse the header and the first few lines of data to generate the schema and allow you to inspect it. You can also preview the schema information here and just make sure nothing looks wrong or needs to be changed. It doesn't appear there are any issues with the detected schema so we'll move on.
- Connector Refresh Schedule (optional)
Choose how often you want to check for new data in the configured source.
- For REFRESH SCHEDULE check theSystem default (Once an hour) option, but you can go as granular as 1 minute if desired.
-
Processing Priority (optional)
Processing Priority will be used to determine which components to schedule first. Higher priority numbers are scheduled before lower ones. Increasing the priority on a component also causes all its upstream components to be prioritized higher. For this tutorial, we will leave it unconfigured. -
Finish and Preview
Click the CREATE button to create the connector and have Ascend ingest and parse it into your Dataflow.

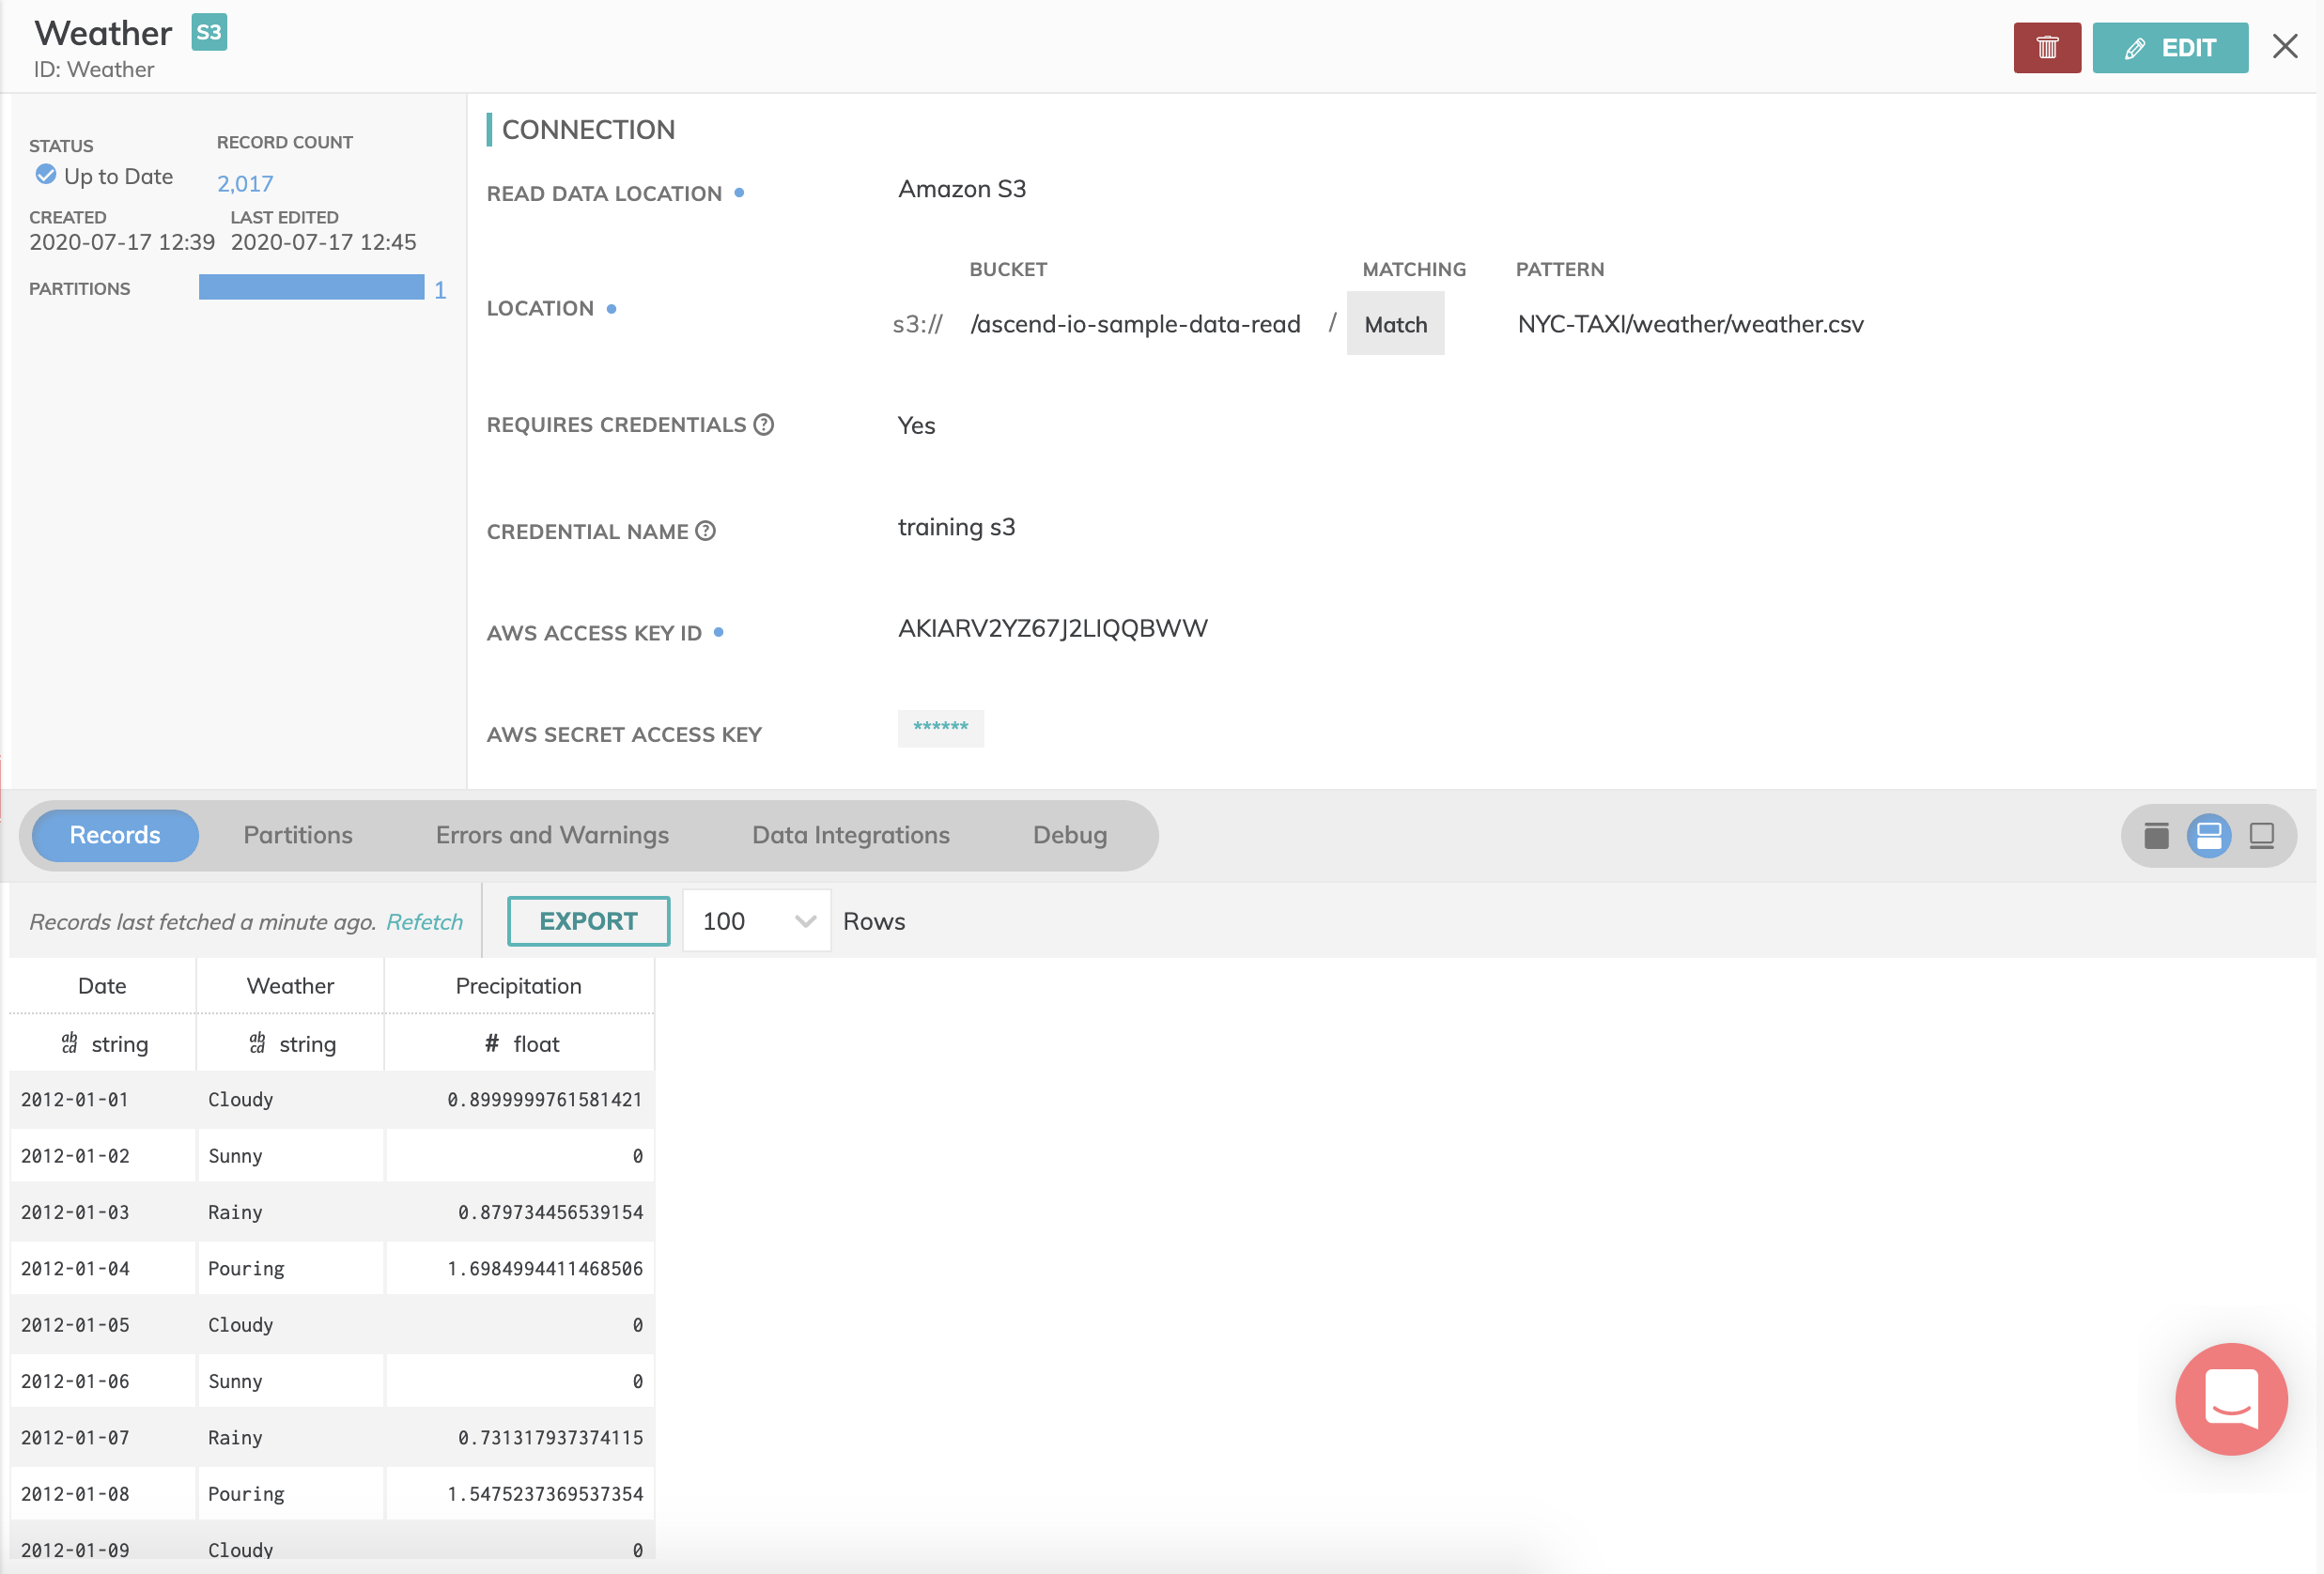
When it's complete you should see the Read Connector on your Dataflow canvas (as shown below). Click on the vertical ellipsis "⋮" to View information regarding this component.

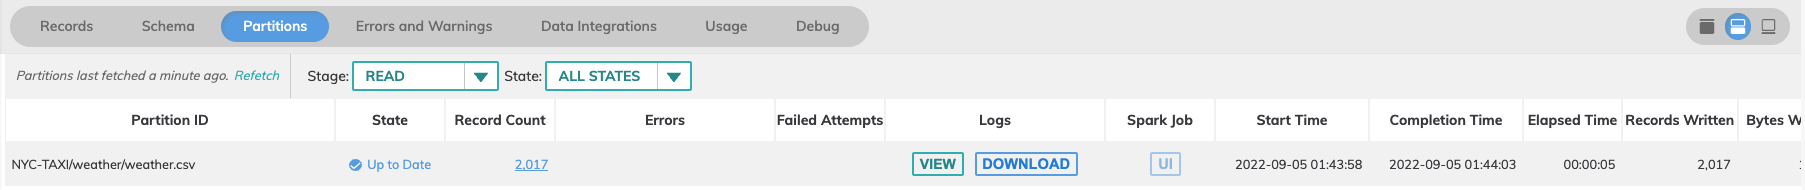
You can choose to preview and inspect the Weather Read Connector by clicking on the Records tab and viewing the contents of them and looking at the Partitions tab for information on column stats and job details like elapsed time, etc. If any errors are detected you can click on the Errors and Warnings tab to view them.
Create "Yellow Taxi" Read Connector
Follow the same directions as we did for the Weather dataset, but use the following names and configuration settings.
-
Click Read Connector and then select USE on the Sample Datasets Read Connector to bring up the BROWSE AND SELECT DATA TO INGEST panel and click on Skip and configure manually again.
-
Enter Yellow Cabs as the name of the connector.
-
Select Regex for OBJECT PATTERN MATCHING and enter NYC-TAXI/yellow_cab/2016-01/.*.csv as the OBJECT PATTERN.
-
Parser Settings:
- Select CSV as the PARSER
- Check Files have a header row checkbox.
- Select PERMISSIVE as MODE.
-
Schema Settings:
Click on GENERATE SCHEMA to see a preview of the CSV. Ascend will automatically parse the header and the first few lines of data to generate the schema and allow you to inspect it.
As you scroll through here you'll notice that columns Tip Amount and Tolls Amount are detected as Double. By default, if the schema contains some fields that look like non-string data, like dates or numbers we will try to automatically convert them.
-
ASSIGNED PRIORITY: Leave unconfigured as 0 (default)
-
Click the CREATE button.
When it's complete you should see the Yellow Cabs Read Connector on your Dataflow canvas (as shown below). As mentioned previously, you can choose to preview and inspect the Yellow Cabs Read Connector by clicking on the vertical ellipsis and viewing the information and looking at the partition information to look at column stats and job details like elapsed time, etc.

Create "Green Taxi" Read Connector
Follow the same directions as we did for the Weather and Yellow Cab Read Connectors, but use the following names and configuration settings.
-
Click Read Connector and then select USE on the Sample Datasets Read Connector to bring up the BROWSE AND SELECT DATA TO INGEST panel and click on Skip and configure manually again.
-
Enter "Green Cabs" as the name of the connector.
-
Select Regex for OBJECT PATTERN MATCHING and enter NYC-TAXI/green_cab/2016-01/.*.csv as the OBJECT PATTERN.
-
Parser Settings:
- Select CSV as the PARSER
- Check Files have a header row checkbox.
- Select PERMISSIVE as MODE.
-
Schema Settings:
Click on GENERATE SCHEMA to see a preview of the CSV. Ascend will automatically parse the header and the first few lines of data to generate the schema and allow you to inspect it. -
ASSIGNED PRIORITY: Leave unconfigured as 0 (default)
-
Click the CREATE button.
When it's complete you should see the Green Cabs Read Connector on your Dataflow canvas (as shown below). As mentioned previously, you can choose to preview and inspect the Green Cabs Read Connector by clicking on the vertical ellipsis and viewing the information and looking at the partition information to look at column stats and job details like elapsed time, etc.

Creating Transforms
As soon as you have one or more read connectors (or data feed) you can start creating Ascend Transforms to do things like cleaning, filtering, joining and aggregating your data using SQL. Additionally, you can specify PySpark functions for specific compute and machine learning model training purposes.
In this part of the tutorial, we'll create a Transform for each Read Connector we just created.
Create "Weather" Transform
We need to do some cleanup and prep on our Weather dataset that we just ingested. Specifically, some column heading names, TIMESTAMP formatting and filtering out all records that have no precipitation. Let's do that using some SQL code in a Transform.
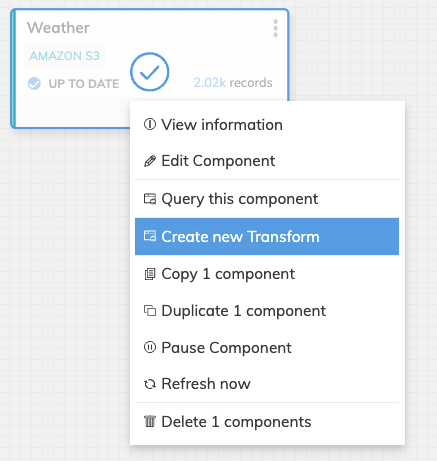
- Create the new Transform by right-clicking the Weather Read Connector and selecting Create new transform from the drop-down menu. Alternatively, you can click CREATE menu and select Transform from there. This will bring up the CREATE NEW TRANSFORM screen (shown below).
- The name of the Transform is generated automatically as Weather transform, but you can override and choose your own name. You may optionally provide a description for this Transform.
-
Select the Query Type based on the type of Transform you're building. In this part of the tutorial, we're going to use SQL code to do the cleanup so we'll be selecting Spark SQL*. Alternatively, if you wanted to create a PySpark function you could do that here as well by selecting PySpark**.
-
Selecting SQL will provide you with a simple SELECT statement as a boilerplate, but we'll be adding editing to this.
-
Enter the following code into the query editor.
SELECT
    ww.Date,
    ww.Weather,
    ww.Precipitation AS precipitation,
    TIMESTAMP(ww.Date) AS weather_date_ts
FROM {{Weather}} AS ww
WHERE LENGTH(TRIM(ww.Precipitation)) != 0
-
ASSIGNED PRIORITY: Leave unconfigured as 0 (default)
-
Click the CREATE button and Ascend will begin processing your SQL query immediately. When it's finished it should look like this.

- You can choose to preview and inspect the results of the Transform by clicking on the vertical ellipsis and clicking on View Information to view the contents of them and looking at the Partitions tab for information on column stats and job details like elapsed time, etc. If any errors are detected you can click on the Errors and Warnings tab to view them.
Create "Yellow Cab" Transform
We need to do some cleanup and prep on our Yellow Cab dataset that we just ingested. Specifically, some column heading names, TIMESTAMP formatting, add new columns to identify these are "Yellow" cabs and filter out all bad records that have no recorded distance. Let's do that using some SQL code in a Transform using the same set of steps used to previously create the Weather Transform.
-
Create the new Transform by right-clicking the Yellow Cabs Read Connector and selecting Create new Transform from the drop-down menu.
-
The name of the Transform is generated automatically as Yellow Cabs Transform.
-
Select Spark SQL as the Query Type.
-
Replace the boilerplate code in the query editor with the following:
SELECT
    i.VendorID,
    TIMESTAMP(i.tpep_pickup_datetime) AS pickup_datetime,
    TIMESTAMP(i.tpep_dropoff_datetime) AS dropoff_datetime,
    i.RatecodeID AS ratecodeID,
    i.passenger_count AS passenger_count,
    i.trip_distance AS trip_distance,
    i.fare_amount AS fare_amount,
    i.mta_tax AS mta_tax,
    i.tip_amount AS tip_amount,
    i.tolls_amount AS tolls_amount,
    i.improvement_surcharge AS improvement_surcharge,
    i.total_amount AS total_amount,
    i.payment_type AS payment_type,
    'yellow' AS cab_type,
    DATE_TRUNC('DAY', TIMESTAMP(i.tpep_pickup_datetime)) AS pickup_date
FROM
    {{Yellow_Cabs}} AS i
WHERE
i.trip_distance > 0-
ASSIGNED PRIORITY: Leave unconfigured as 0 (default)
-
Click the CREATE button and Ascend will begin processing your SQL query immediately. When it's finished it should look like this.

- You can once again choose to preview and inspect the results of the Transform by clicking on the vertical ellipsis and clicking on View Information to view the contents of them and looking at the Partitions tab for information on column stats and job details like elapsed time, etc. If any errors are detected you can click on the Errors and Warnings tab to view them.
Create "Green Cab" Transform
We need to do some cleanup and prep on our Green Cab dataset that we just ingested. Specifically, changing all the column heading names to match the ones in the Yellow Cabs dataset, TIMESTAMP formatting, adding new columns to identify these are "green" cabs and filtering out all bad records that have no recorded distance. Let's do that using some SQL code in a Transform using the same set of steps used to previously create the Weather Transform.
-
Create the new Transform by right-clicking the Green Cabs Read Connector and selecting Create new Transform from the drop-down menu.
-
The name of the Transform is generated automatically as Green Cabs Transform.
-
Select Spark SQL as the Query Type.
-
Replace the boilerplate code in the query editor with the following:
SELECT
    i.VendorID,
    TIMESTAMP(i.lpep_pickup_datetime) AS pickup_datetime,
    TIMESTAMP(i.Lpep_dropoff_datetime) AS dropoff_datetime,
    i.RateCodeID AS ratecodeID,
    i.Passenger_count AS passenger_count,
    i.Trip_distance AS trip_distance,
    i.Fare_amount AS fare_amount,
    i.MTA_tax AS mta_tax,
    i.Tip_amount AS tip_amount,
    i.Tolls_amount AS tolls_amount,
    i.improvement_surcharge AS improvement_surcharge,
    i.Total_amount AS total_amount,
    i.Payment_type AS payment_type,
    "green" AS cab_type,
    TIMESTAMP(SUBSTR(i.lpep_pickup_datetime, 1, 10)) AS pickup_date
FROM {{Green_Cabs}} as i
WHERE i.trip_distance > 0-
ASSIGNED PRIORITY: Leave unconfigured as 0 (default)
-
Click the CREATE button and Ascend will begin processing your SQL query immediately. When it's finished it should look like this.

- You can once again choose to preview and inspect the results of the Transform by clicking on the vertical ellipsis and clicking on View Information to view the contents of them and looking at the Partitions tab for information on column stats and job details like elapsed time, etc. If any errors are detected you can click on the Errors and Warnings tab to view them.
Create "All Cabs" Transform
Now we want to combine both Yellow Cab and Green Cab data into a single dataset using a UNION. Let's do that using some SQL code in a Transform using the same set of steps used to previously create the Yellow Cabs Transform.
-
Create the new Transform by right-clicking the Yellow Cabs Read Connector and selecting Create new transform from the drop-down menu.
-
Overwrite the name of this transform with All Cabs Transform.
-
Select Spark SQL as the Query Type.
-
Replace the boilerplate code in the RAW BUILDER editor with the following:
SELECT *
FROM {{Yellow_Cabs_transform}}
UNION
SELECT *
FROM {{Green_Cabs_transform}}5.ASSIGNED PRIORITY: Leave unconfigured as 0 (default)
- Click the CREATE button and Ascend will begin processing your SQL query immediately. When it's finished it should look like this.

- You can once again choose to preview and inspect the results of the Transform by clicking on the vertical ellipsis and clicking on View Information to view the contents of them and looking at the Partitions tab for information on column stats and job details like elapsed time, etc. If any errors are detected you can click on the Errors and Warnings tab to view them.
Create "NYC Cab Rides on Rainy Days" Transform
Now let's do something interesting by joining the result datasets from the All Cabs and Weather Transforms based on date and filter based on when the weather is rainy and when the number of passengers is greater than 3. Let's do that using some Spark SQL code in a Transform.
-
Create the new Transform by right-clicking the All Cabs Read Connector and selecting Create new transform from the drop-down menu.
-
Overwrite the name of this transform with NYC Cab Rides on Rainy Days Transform.
-
Select Spark SQL as the Query Type.
-
You can also reorder your Spark SQL query as follows. You'll notice as you type that autocompletion will help with suggestions that you can actually accept immediately.
FROM
    {{All_Cabs_transform}} AS cabs

INNER JOIN
    {{Weather_transform}} AS w

ON
    cabs.pickup_date = w.weather_date_ts

SELECT
    cabs.VendorID,
    cabs.pickup_datetime,
    cabs.dropoff_datetime,
    cabs.passenger_count,
    cabs.trip_distance,
    cabs.fare_amount,
    cabs.mta_tax,
    cabs.tip_amount,
    cabs.tolls_amount,
    cabs.improvement_surcharge,
    cabs.total_amount,
    cabs.payment_type,
    cabs.cab_type,
    cabs.pickup_date,
    w.Date,
    w.Weather,
    w.precipitation

WHERE
    w.Weather = 'Rainy' and cabs.passenger_count > 3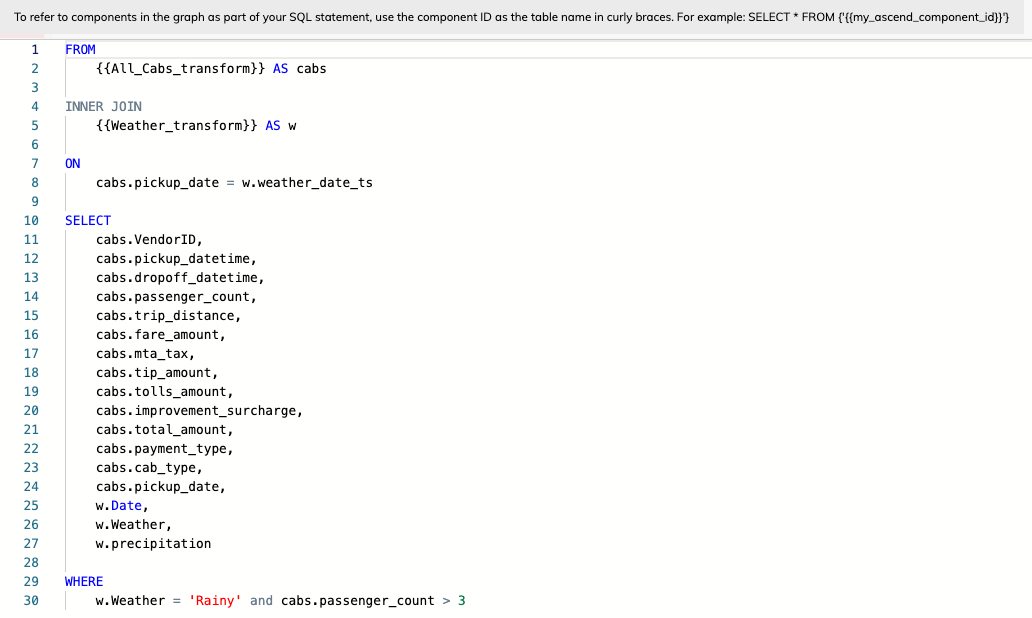
-
ASSIGNED PRIORITY: Leave unconfigured as 0 (default)
-
Click the CREATE button and Ascend will begin processing your SQL query immediately. When it's finished it should look like this.

- You can once again choose to preview and inspect the results of the Transform by clicking on the vertical ellipsis and clicking on View Information to view the contents of them and looking at the Partitions tab for information on column stats and job details like elapsed time, etc. If any errors are detected you can click on the Errors and Warnings tab to view them.
Creating Write Connectors
The last step in our Dataflow is to create a Write Connector that will create a destination file containing the results of the NYC Cab Rides on Rainy Day Transform you just created.
Access to a Read-Write S3 bucketFor this step, you are going to create it within your own S3 account. The public bucket we used earlier in this tutorial does not have WRITE access. Every object in Amazon S3 is stored in a bucket.
Before you can store data in Amazon S3, you must create an S3 bucket and be granted programmatic access to the S3 bucket. If you don't have a proper S3 account to write to then you can skip to the next section of this tutorial where we'll create a write connector and a data feed.
Create "NYC Cab Rides on Rainy Days" Write Connector
- Create the new Write Connector by right-clicking the NYC Cab Rides on Rainy Days Transform and selecting Create new Write Connector from the drop-down menu. Alternatively, you can click Create tab and on the DELIVER section, select Write Connector to bring up the Connectors panel where you'll get a list of all possible pre-built Write Connectors to choose from and can select the S3 Write Connector from there.

This will bring up the CREATE NEW WRITE CONNECTOR screen. Click on + NEW CONNECTION and choose your preferred blob storage. For this tutorial, we will connect to Amazon S3.
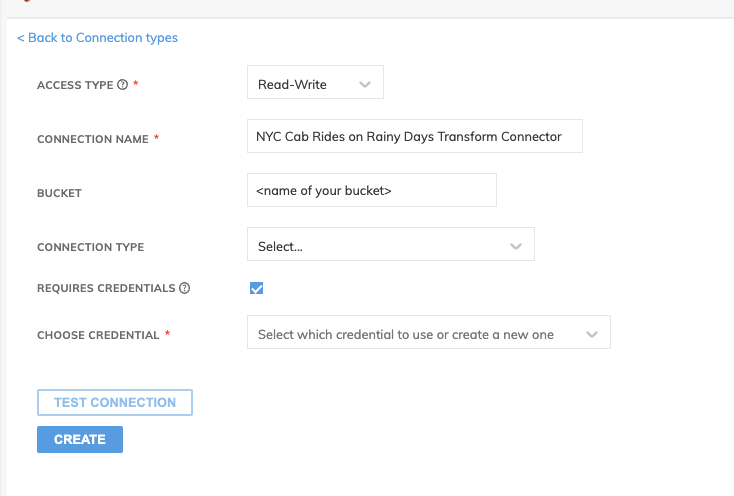
- NEW AMAZON S3 CONNECTION details:
- Select Read-Write for ACCESS TYPE.
- Use NYC Cab Rides on Rainy Days Transform Connector for CONNECTION NAME.
- Type in the name of your S3 bucket for BUCKET.
- Check REQUIRES CREDENTIALS checkbox and choose Create new credentials from CHOOSE CREDENTIAL.
- Create new credential details:
- Enter AWS-Taxi-Demo as CREDENTIAL NAME.
- (optional) If you haven't, create an Access Key on your AWS account.
- Enter your AWS ACCESS KEY ID and AWS SECRET ACCESS KEY
- Click UPDATE.

- On the main connection page, click TEST CONNECTION to make sure everything is green and then click CREATE. If you have been following the tutorial, you will now see two S3 connections: one for Sample Datasets and the other for NYC Cab Rides on Rainy Days Transform Connector.

- Click USE on the NYC Cab Rides on Rainy Days Transform Connector.
- Name: You can use the default name for the write connector or type in your own.
- S3 bucket: Leave it empty as your S3 bucket has been selected.
- Prefix: Enter an S3 folder path within your S3 bucket.
- Pattern: Leave empty (for this example).
- Suffix: Enter .csv as the file suffix.
- FILES HAVE A HEADER ROW: check the checkbox
WARNING!Any data that is not being propagated by the upstream transform will automatically be deleted under the object prefix. Therefore, be sure the bucket and object prefix path don't already contain any pre-existing data as it will be overwritten.
S3 Write Location Details
- Bucket: The S3 bucket name (e.g. my_data_bucket). Do not put in any folder information in this box.
- Object Prefix: The S3 folders hierarchical prefix (e.g. good_data/my_awesome_table). Do not include any leading forward slashes.
- Partition Folder Pattern: The folder pattern that will be generated based on the values from the upstream partition column (e.g. you can use ${at_hour_ts(yyyy-MM-dd/HH)} where column at_hour_ts is a partition column from the upstream transform).
-
Format Settings:
- Select CSV as the FORMAT TO USE to write the data as .csv compatible.
- For HEADER ROW check the Files have a header row checkbox to indicate that the header row will contain the column names.
- COMPRESSION METHOD: Leave unconfigured. (optional).
-
Leave Manifest File unselected.
-
Click the CREATE button and Ascend will write the file out to S3.
When it's complete you should see the Write Connector on your Dataflow canvas (as shown below).

Awesome! You’ve now seen a very simple example of a Dataflow which contains a couple of Read Connectors, a few Transform Connectors and a Write Connector. Let's add one final component to our Dataflow in the final step next.
Creating Data Feed Connectors
The final step in our Dataflow is to create a Data Feed. Data feeds are powerful constructs designed to allow Dataflows and Data Services to communicate live data with each other. What this means is you can create a very complex Dataflow that outputs a single result table and share it with others in your organization (say in different data services) without having to give them access to your actual Dataflow. You connect to existing Data Feed Connectors to act as inputs into other Dataflows.
Create "Rainy Day Cab Rides" Data Feed Connector
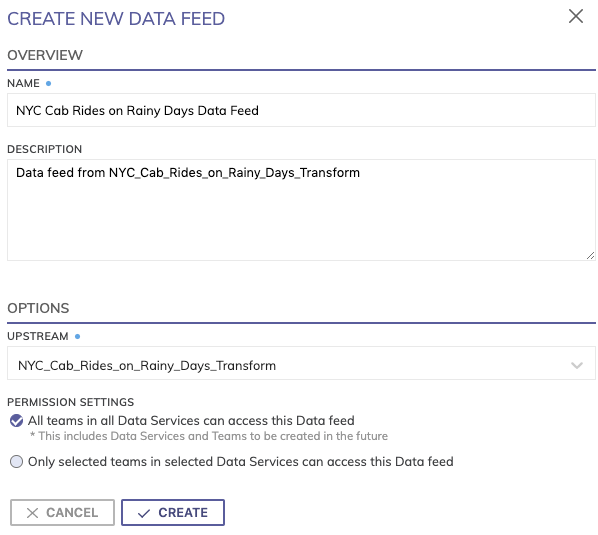
- Create the new Data Feed Connector by right-clicking the NYC Cab Rides on Rainy Days Transform and selecting Create new Data Feed from the drop-down menu. Alternatively, you can click Create menu and select Create Data Feed and then Create to open the CREATE NEW DATA FEED panel (shown below).

-
The name of the Data Feed Connector is generated automatically as NYC Cab Rides on Rainy Days Transform data feed, but we're going to override this with the name NYC Cab Rides on Rainy Days Data Feed.
-
The upstream is already pre-selected for you as NYC_Cab_Rides_on_Rainy_Days_Transform.
-
You can choose to apply access permissions to this if you want, but for now, we’ll make it available to all in our environment so we'll leave the default "All teams in all Data Services can access this Data feed".
- Click CREATE and that’s it. You should see the Data Feed Connector on your Dataflow canvas (as shown below). You now have a dedicated data spigot that contains a very specific data set that you can allow others to subscribe to and build their Dataflows off.

Wrapping it up
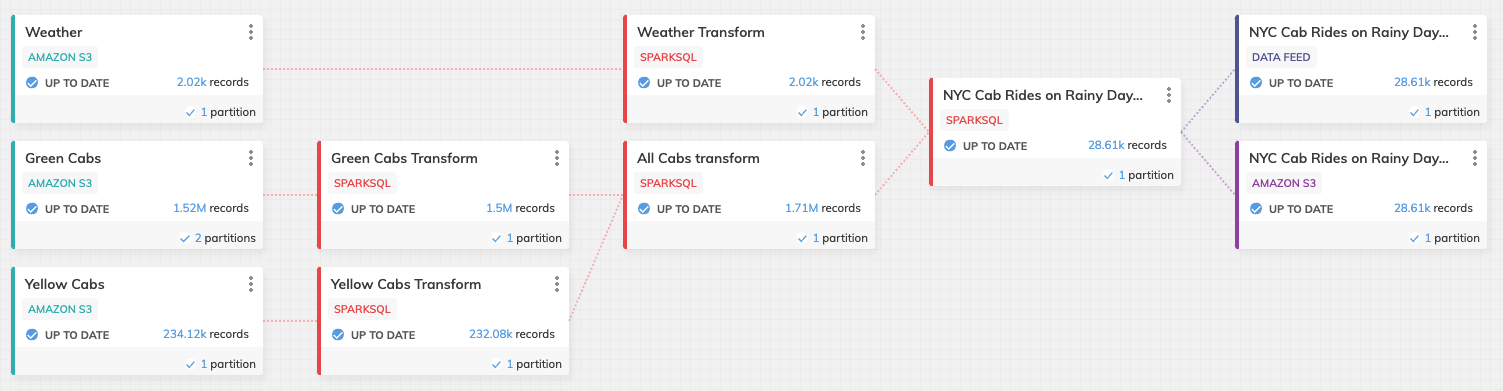
Congratulations on creating your first orchestrated Dataflow with Ascend. Hopefully, you got a real good sense of the power in what Ascend can do for you - and that you can now build your own Dataflows. You've seen how easy it is to create Read Connectors, use SQL inside of Transforms and writing out those results in the form of Write Connectors and making them available and reuseable as Data Feeds. Here's what your Dataflow should look like.
In the next tutorial, we'll take the Data Feed you just created and use it for an entirely new Data Flow and introduce the use to PySpark in some transforms as well.
Updated 10 months ago